Just as we have seen a dozen times already, buckets can be nested in buckets for more-sophisticated behavior. For illustration, we will build an aggregation that shows the total sum of prices for all makes, listed by quarter. Let us also calculate the sum of prices per individual make per quarter, so we can see which car type is bringing in the most money to our business:
이미 여러 번 본 것과 마찬가지로, 더 복잡한 동작을 위하여, bucket은 bucket 내부에 중첩될 수 있다. 설명을 위해, 분기별로 나열된, 모든 제조업체에 대해, 가격의 총합을 보여주는 aggregation을 구현할 것이다. 또한, 분기별로, 개별 제조업체 별로, 가격의 합을 구할 것이다. 이렇게 하면, 가장 많은 돈을 벌어오는, 자동차의 종류를 알 수 있다.
GET /cars/transactions/_search { "size" : 0, "aggs": { "sales": { "date_histogram": { "field": "sold", "interval": "quarter","format": "yyyy-MM-dd", "min_doc_count" : 0, "extended_bounds" : { "min" : "2014-01-01", "max" : "2014-12-31" } }, "aggs": { "per_make_sum": { "terms": { "field": "make" }, "aggs": { "sum_price": { "sum": { "field": "price" }
} } }, "total_sum": { "sum": { "field": "price" }
} } } } }
This returns a (heavily truncated) response:
아래와 같은 response를 반환한다.
{
....
"aggregations": {
   "sales": {
      "buckets": [
         {
            "key_as_string": "2014-01-01",
            "key": 1388534400000,
            "doc_count": 2,
            "total_sum": {
               "value": 105000
            },
            "per_make_sum": {
               "buckets": [
                  {
                     "key": "bmw",
                     "doc_count": 1,
                     "sum_price": {
                        "value": 80000
                     }
                  },
                  {
                     "key": "ford",
                     "doc_count": 1,
                     "sum_price": {
                        "value": 25000
                     }
                  }
               ]
            }
         },
...
}
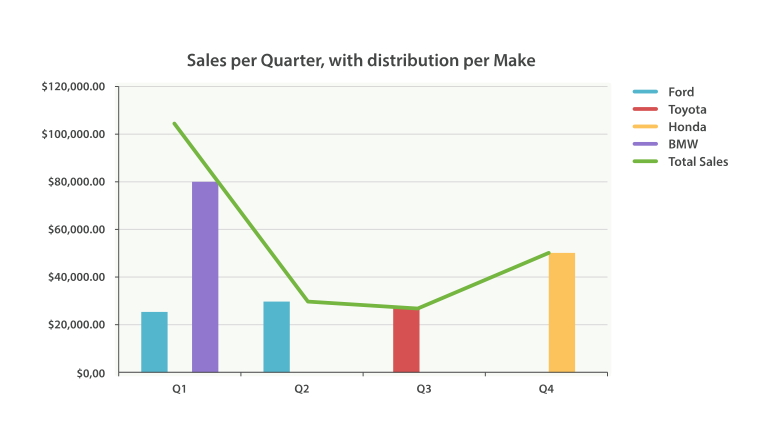
We can take this response and put it into a graph, showing a line chart for total sale price, and a bar chart for each individual make (per quarter), as shown in Figure 38, “각 제조업체별 분포가 있는 분기별 판매액”.
이 response를 그래프에 바로 넣으면, Figure 38, “각 제조업체별 분포가 있는 분기별 판매액”에서 볼 수 있듯이, 총 판매가는 line chart로, 각 분기별, 개별 제조업체별 판매가는 bar chart로 보여준다.
'2.X > 4. Aggregations' 카테고리의 다른 글
| 4-04. Looking at Time (0) | 2017.09.24 |
|---|---|
| 4-04-1. Returning Empty Buckets (0) | 2017.09.24 |
| 4-04-3. The Sky’s the Limit (0) | 2017.09.24 |
| 4-05. Scoping Aggregations (0) | 2017.09.24 |
| 4-06. Filtering Queries and Aggregations (0) | 2017.09.23 |
