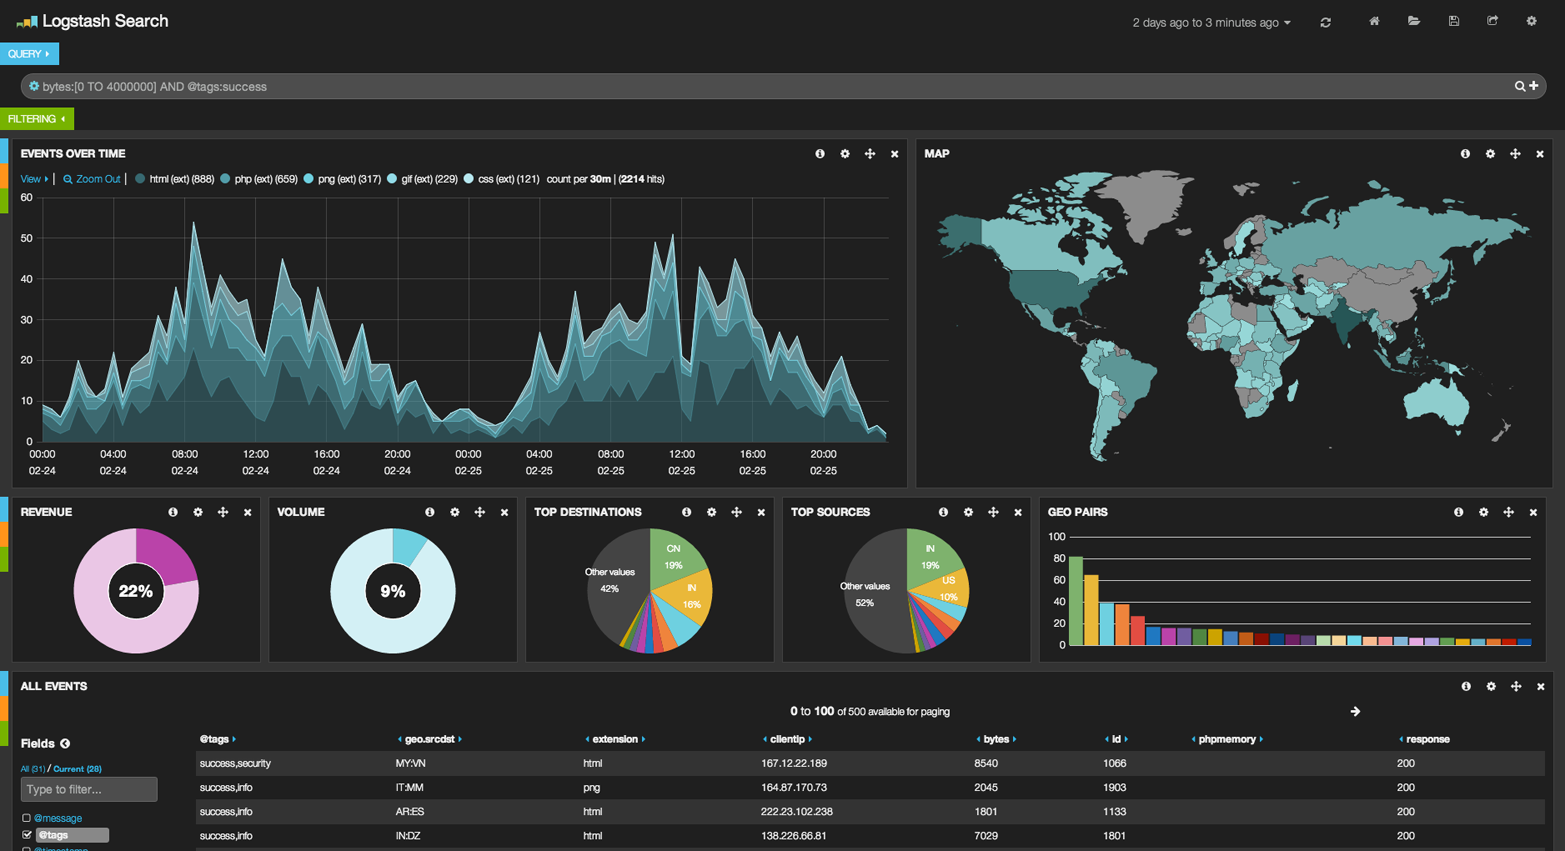
These were obviously simple examples, but the sky really is the limit when it comes to charting aggregations. For example, Figure 39, “Kibana—aggregation을 가지고 만든 실시간 분석 dashboard”shows a dashboard in Kibana built with a variety of aggregations.
이것들은 분명히 간단한 예제이지만, chart aggregation으로 하지 못할 것이 없다. 예를 들자면, Figure 39, “Kibana—aggregation을 가지고 만든 실시간 분석 dashboard”은, 다양한 aggregation을 가지고 만든, Kibana의 dashboard이다.
Because of the real-time nature of aggregations, dashboards like this are easy to query, manipulate, and interact with. This makes them ideal for nontechnical employees and analysts who need to analyze the data but cannot build a Hadoop job.
aggregation의 실시간이라는 특성으로 인하여, 이 같은 dashboard는 query, 조작, 상호작용이 쉽다. 이것은 기술직이 아닌 직원과, Hadoop을 만들 수는 없지만, 데이터를 분석해야 하는 분석가에게 이상적이다.
To build powerful dashboards like Kibana, however, you will likely need some of the more advanced concepts such as scoping, filtering, and sorting aggregations.
그러나, Kibana같은 강력한 dashboard를 만들기 위해, 범위의 지정, filtering, aggregation의 정렬 같은, 몇 가지 고급스러운 개념이 필요하다.
'2.X > 4. Aggregations' 카테고리의 다른 글
| 4-04-1. Returning Empty Buckets (0) | 2017.09.24 |
|---|---|
| 4-04-2. Extended Example (0) | 2017.09.24 |
| 4-05. Scoping Aggregations (0) | 2017.09.24 |
| 4-06. Filtering Queries and Aggregations (0) | 2017.09.23 |
| 4-06-1. Filtering Queries (0) | 2017.09.23 |
